Quick Start
You can use the performance management function to collect the history performance data of the network. According to the performance data, you can learn and analyze the network performance and improve the network performance.
The quick start describes how to use the performance management function and shows the configuration procedure of each functional module.
Primary Process
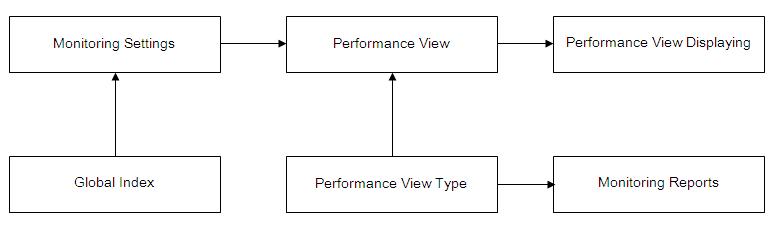
The primary process is as follows:
- Add instances for monitoring in Monitoring Settings, and set the thresholds and collection interval for indices in Global Index Settings.
- Create views for displaying performance data in Performance View and you can define multiple view types for a performance view, thus displaying data in multiple methods.
- The view types set in the performance views provide plenty of performance data displaying methods. When the TopN, trend line, or data grid view type is used, you can switch indexes to display different performance data. When the at a glance view type is used, you can switch devices to display different performance data.
Flow Chart